Your First Query
In about 5 minutes you’ll create a connection, run a query against your Fusion instance, and export the results to Excel. That’s the core loop in Data Collage.
If Data Collage isn’t installed and licensed yet, see §3 — Install & Launch first.
By the end of this section you’ll know how to:
- Set up and test a connection
- Open a query from the Query Library
- Run it and inspect the results
- Export the data to a file
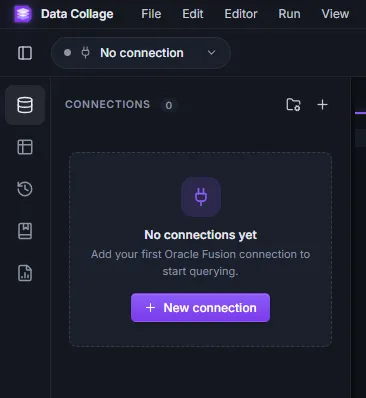
Step 1 — Create a connection
Section titled “Step 1 — Create a connection”Open the Connections panel from the activity bar on the left, then click the + icon (New connection).
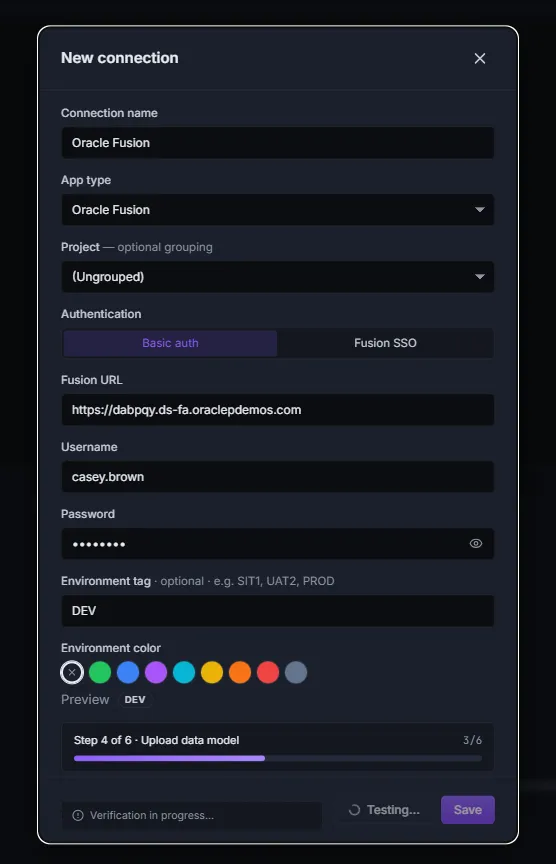
Fill in the form:
| Field | What to enter |
|---|---|
| Connection name | A short label, e.g. Production or SIT1. This is the identity used to store the saved password — pick once, don’t change later. |
| App type | Leave as Oracle Fusion (the only enabled option in V1). |
| Authentication | Select Basic auth. SSO is covered in §5. |
| Fusion URL | Your Fusion home URL, e.g. https://fa-xxxx-saasfaprod1.fa.ocs.oraclecloud.com. No trailing slash. |
| Username | A Fusion user that can run BI Publisher reports. |
| Password | The Fusion password. Click the eye icon to reveal what you typed. |
| Environment tag (optional) | A short label like SIT1, UAT2, PROD that will show as a colored chip in the connection list — helps you avoid running Prod queries by mistake. |
Step 2 — Test the connection
Section titled “Step 2 — Test the connection”Click Test connection at the bottom of the dialog. You’ll see a progress bar walk through six steps:
- Probe the BI Publisher catalog
- Create the
NCDataCanvasfolder (if it doesn’t already exist) - Clean up any stale gateway files
- Upload the data model (
NCCanvasdm.xdmz) - Upload the report (
NCCanvascsv.xdoz) - Run a quick connectivity check (a trivial
SELECT 1 FROM DUALquery) to confirm Data Collage can actually run SQL through the deployed gateway
This is a one-time provisioning step per Fusion instance — Data Collage deploys its own private folder under your user’s BI Publisher catalog at /~{username}/NCDataCanvas/. Subsequent test runs are fast.
If the test fails, the most common causes are:
- URL is wrong — check it against your Fusion home page (no
/fscmUI/, no trailing slash). - Password is wrong or expired — try logging into Fusion in your browser first.
- User lacks BI Publisher role — your user needs the BI Publisher Data Model Developer role (or equivalent) to upload and run reports.
See §15 — Troubleshooting for more.
Step 3 — Save the connection
Section titled “Step 3 — Save the connection”Once Test connection succeeds, the Save button activates. Click it. The connection appears in the Connections panel, and your password is stored in the Windows Credential Manager — never on disk in plain text.
The Save button stays disabled until a successful Test. This is intentional — it prevents you from saving a connection that can’t actually reach your Fusion instance.
Step 4 — Open a sample query
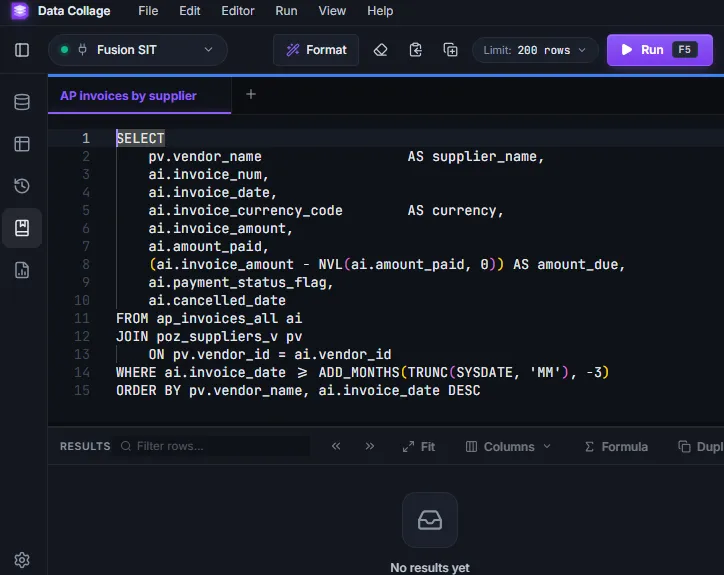
Section titled “Step 4 — Open a sample query”Open the Query Library panel from the activity bar. Type invoices by supplier in the search box, then click the row labeled AP invoices by supplier to expand it, and click Open in new tab.
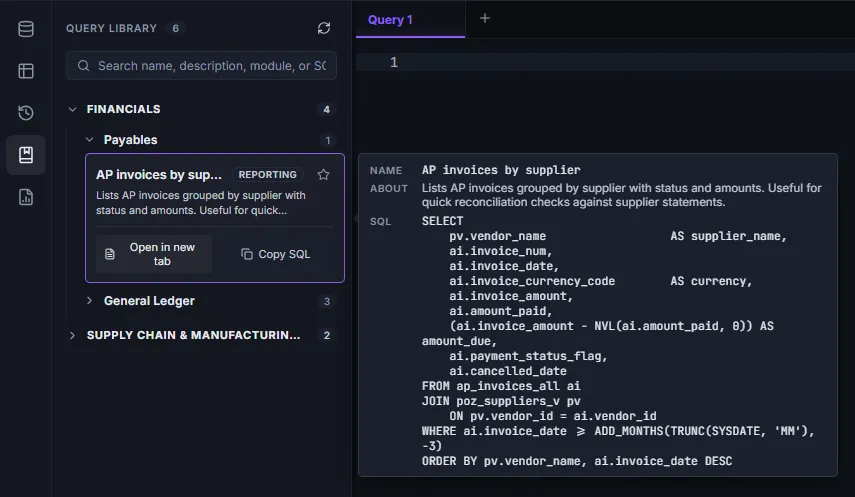
The editor opens a new tab with this SQL:
SELECT pv.vendor_name AS supplier_name, ai.invoice_num, ai.invoice_date, ai.invoice_currency_code AS currency, ai.invoice_amount, ai.amount_paid, (ai.invoice_amount - NVL(ai.amount_paid, 0)) AS amount_due, ai.payment_status_flag, ai.cancelled_dateFROM ap_invoices_all aiJOIN poz_suppliers_v pv ON pv.vendor_id = ai.vendor_idWHERE ai.invoice_date >= ADD_MONTHS(TRUNC(SYSDATE, 'MM'), -3)ORDER BY pv.vendor_name, ai.invoice_date DESCThis lists AP invoices from the last three months, grouped by supplier, with a computed amount_due column.
Step 5 — Run the query
Section titled “Step 5 — Run the query”Press F5 (or Ctrl+Enter) with the cursor anywhere in the SQL. The Run button on the toolbar does the same thing.
The status bar shows Running…, then N rows in M ms when the query completes. Results stream into the grid below the editor.
What “good” looks like:
- A row count in the status bar
- Column headers matching the SELECT list (
supplier_name,invoice_num, …) - Typical first-run latency: a few seconds for small queries, longer for wide date ranges
Click a column header to sort. The full grid feature set — filters, finding duplicates, Top/Bottom N, column formatting, Show/Hide — is covered in §7 — The Result Grid.
Step 6 — Export the results
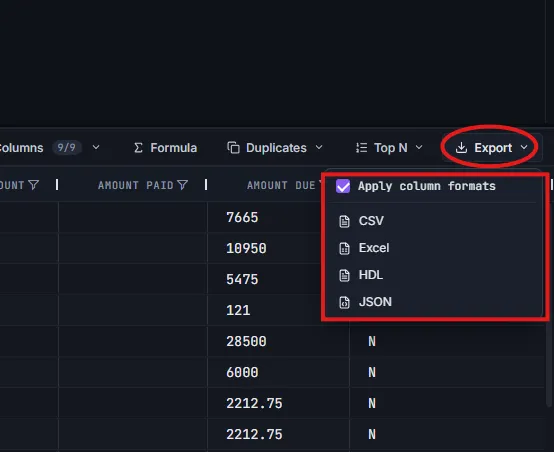
Section titled “Step 6 — Export the results”Click Export on the grid toolbar, then choose Excel.
Pick a folder and filename, then click Save. A toast appears with a Reveal in folder action — click it to open the file’s location in Explorer.
Open the file in Excel. Numeric columns (invoice_amount, amount_paid, amount_due) are typed as Number, not text — so SUM and other formulas work without re-typing the column.
What you just did
Section titled “What you just did”- Configured a connection to your Fusion instance, deploying Data Collage’s BI Publisher gateway in the process
- Ran a real SQL query against Fusion data through that gateway
- Exported the results to Excel
That’s the daily loop. Everything else in this guide makes that loop faster, safer, or more powerful.
Where to go next
Section titled “Where to go next”- §5 — Connections — Fusion SSO, editing/deleting, environment tags
- §6 — The SQL Editor — running multiple statements, Format SQL, bind variables, snippets
- §7 — The Result Grid — filtering, duplicates, Top/Bottom N, column formats
- §9 — Exports — CSV, HDL, JSON details and the “Apply column formats” toggle
- §10 — Saved Analyses — save a query + its formulas + its grid layout as a reusable
.dcanalysisfile